
Georgia Tech OMSCS Artificial Intelligence Review | CS 6601
TL;DR
- Medium-Hard
- Avg 20 hrs per week
- Get a free pass on 1 of 6 projects
What is Artificial Intelligence?
Artificial Intelligence (AI) is basically getting computers to do human tasks.
Graded course material
- 6 projects
- 12% each
- 1 of them is dropped from your grade
- Very programming heavy
- 2 exams
- Midterm is 15%
- Final is 20%
- Extra credit
- 2 of the projects offer extra credit
- My semester there was an additional extra credit opportunity for watching Meta lectures
- Curved grading
- Above the class median is an A
- 1 standard deviation below the median is a B
Project overview
Tri-directional search
In this project, you're given a map of cities, and start by implementing some search algorithms to get from point A to point B
Algorithms used are:
- Breadth-first search
- Uniform cost search
- A* search
- Bidirectional uniform cost search
- Bidirectional A*
- Tridirectional search
Breadth-first search
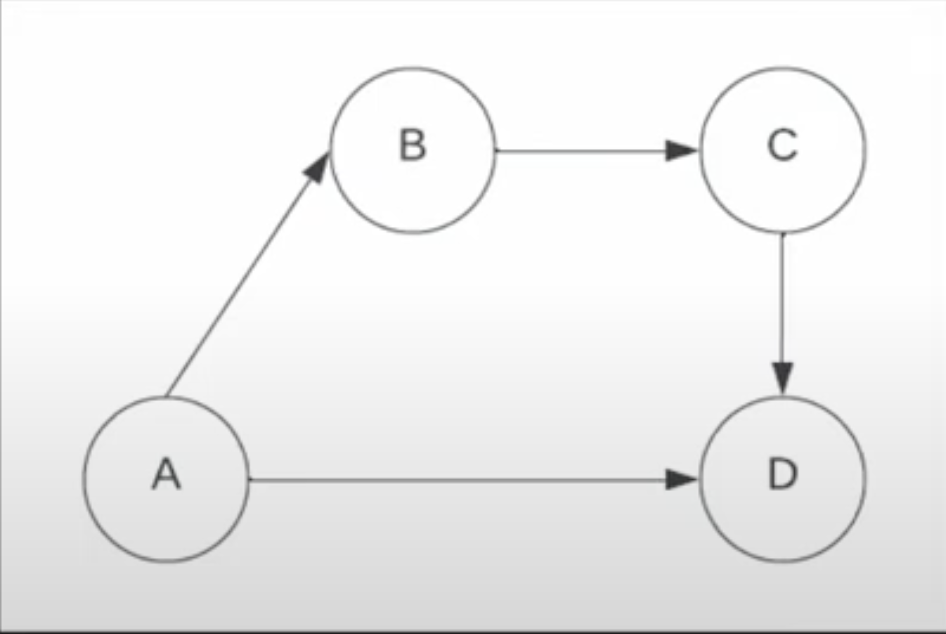
Let's say the graph of cities is like in the picture below, the paths explored would be:
- A->B
- A->D
Uniform cost search
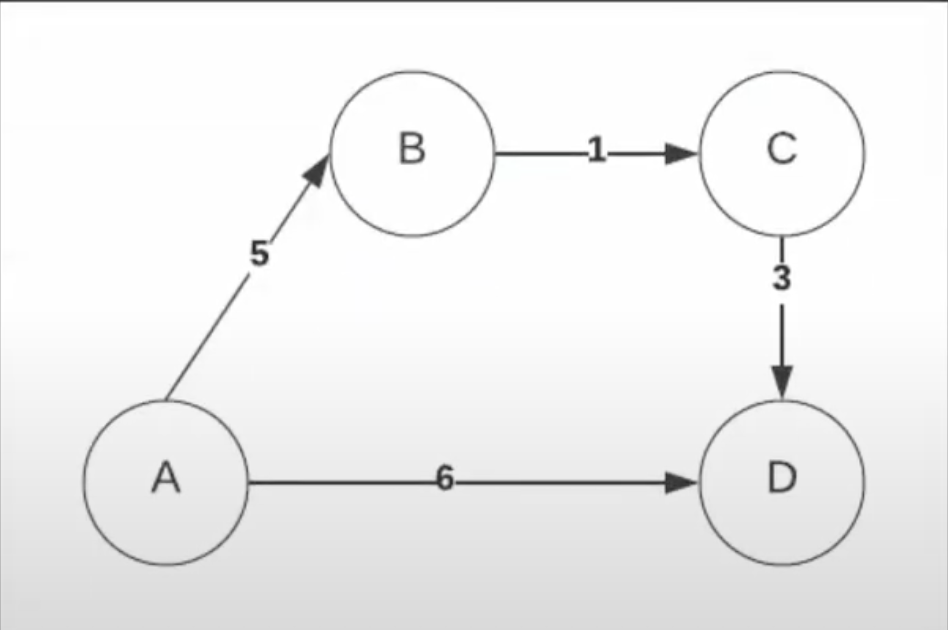
If given the blow graph for uniform cost search, the paths explored would be:
- A->B (5)
- A->B->C (6)
- A->D (6)
With uniform cost search, you just take the cheapest path every time.
It is guaranteed to find the shortest path from point A to point B, but is very costly with big graphs
A* search
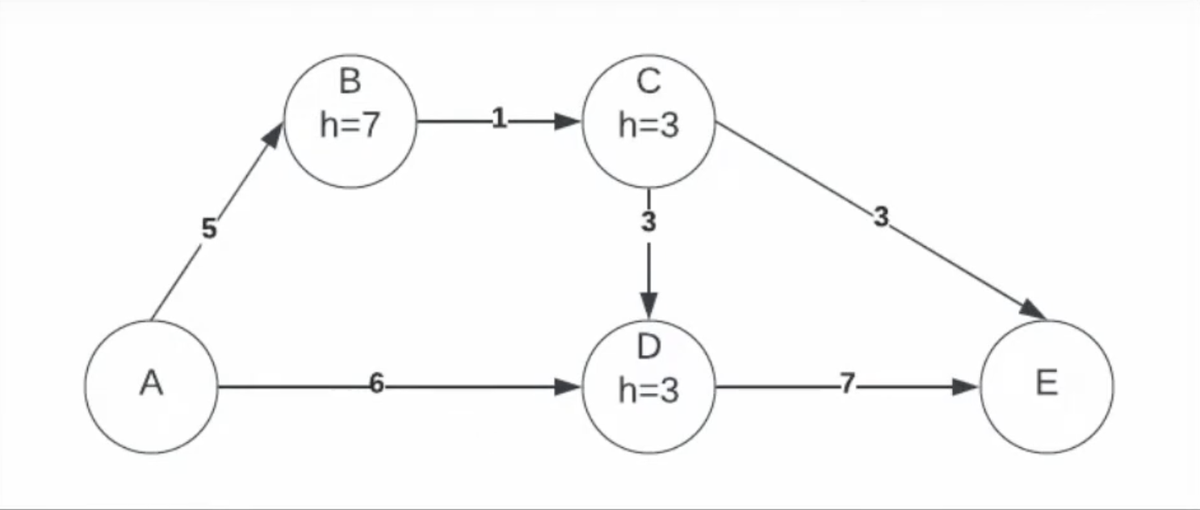
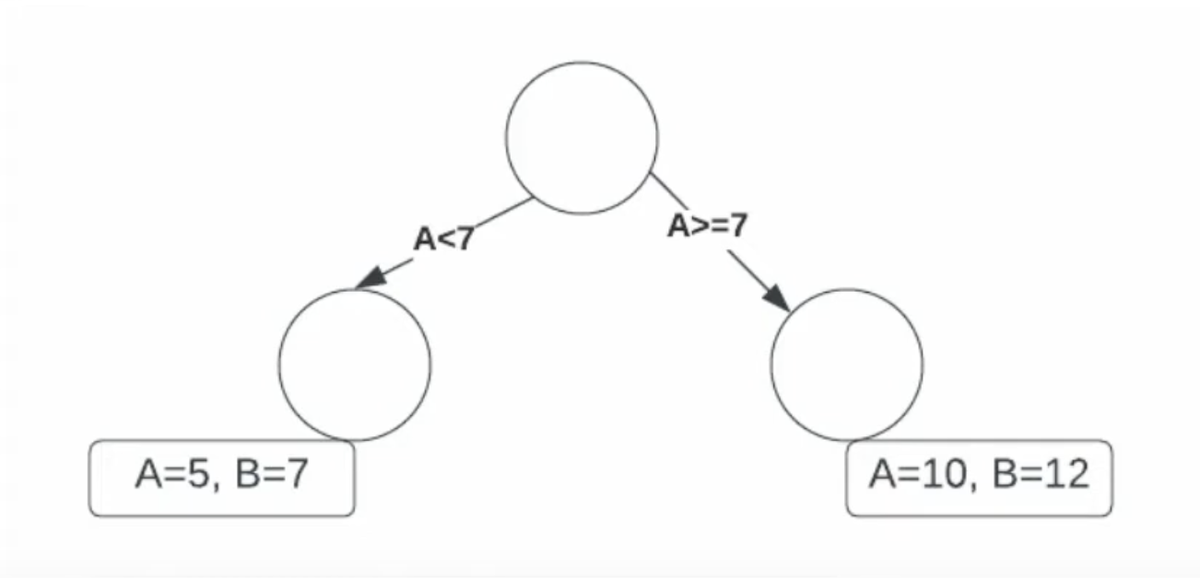
With A* search, you have some kind of estimate as to how far away a point is from it's destination (h).
You then combine how far it took you to get to your current point (g), plus the estimate to your destination, to choose the next point to explore.
In the below example, the paths explored would be:
- A->B (g=5, h=7, total cost of 12); A->D (g=6, h=3, total cost of 9)
- A->D->E (g=13, h=0, total cost of 13) but we're not done yet, the algo ends when goal is popped off, not put on
- A->B->C (g=6, h=3, total cost of 9)
- A->B->C->D (g=9, h=3, total cost of 9); A->B->C->E (g=9, h=0, total cost of 9, and update to use this path, rather than A->D->E)
- A->B->C->E
Bidirectional uniform cost search
Basically, you do uniform cost search, but from the start point AND from the end point, and see where the two paths meet in the middle
Bidirectional A*
Same thing, you do A* from start and end and merge paths where they meet in the middle
Tridirectional search
This one's a doozey, my advice is to not use a greedy approach
Use a switch-approach, meaning expand start path, then expand the end path, alternating back and forth until they overlap
And “overlapped” means when your “popped” or AKA “explored” maps meet, not simply when your “frontier” maps meet
Isolation
I did not do this project since I was so time-crunched for work 😋
- The github repo for it (public to GT students) is here: omscs6601/assignment_2
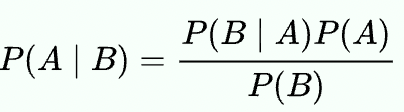
Bayes Nets
Probability based, implementing the Baye's rule
You're given a set of “alarms”, that only sound on certain conditions; i.e. “The alarm has a 15% chance of sounding when the temperature drops below freezing”
I would read very carefully the documentation here: https://pgmpy.org/models/bayesiannetwork.html as it explains one example using grades very well
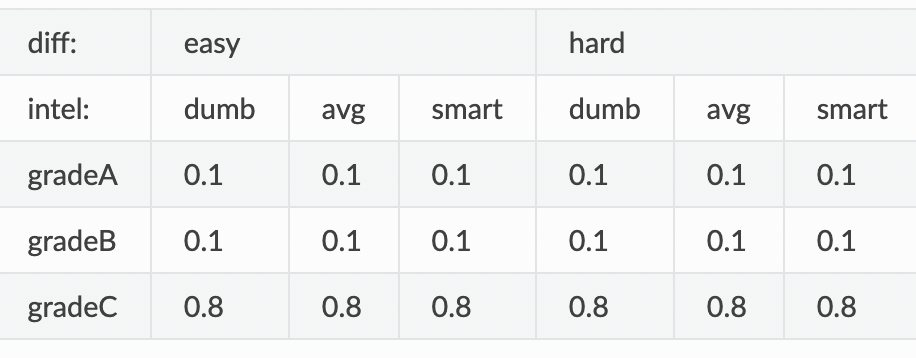
Noice how all the columns add up to 1
So this is saying “Given that the class is easy, the student is smart, the chance the student gets a grade C is 80%”
You just have to make similar tables for the problem they give you
For example, if the information given to you were “It is rainy, 90% of the time”, you might make a table like:
So False value comes first (10%), True value comes second (90%)
You also do a soccer game matchup problem, which is just bigger tables. Then you sample from those using a couple algorithms.
You only get 5 submissions on this project so choose carefully.
Decision Trees
This is your typical decision tree, basically like this picture:
Gaussian Mixture Models
Prepare yourself
In this project, you are clustering pixels in an image, and are given a few algorithms to implement via a research paper:
- k-means clustering
- Gaussian mixture models
- Bayesian information criterion
K-means clustering
For K-means clustering, you are going to use numpy to sample random points from a given array (pixels)
You then take those points, and use them as cluster centers
Gradually moving those cluster centers around, until they stop changing
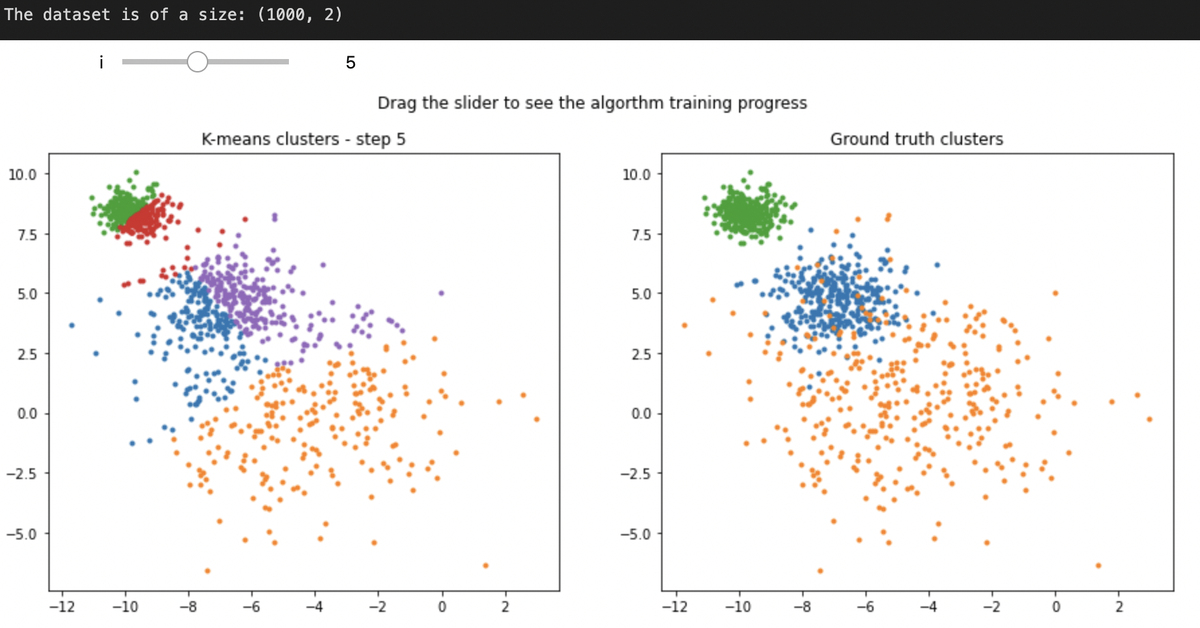
K-means clustering : continued
Next you'll cluster a picture, then segment the image, by making all the pixels that belong to a cluster, that mean cluster value
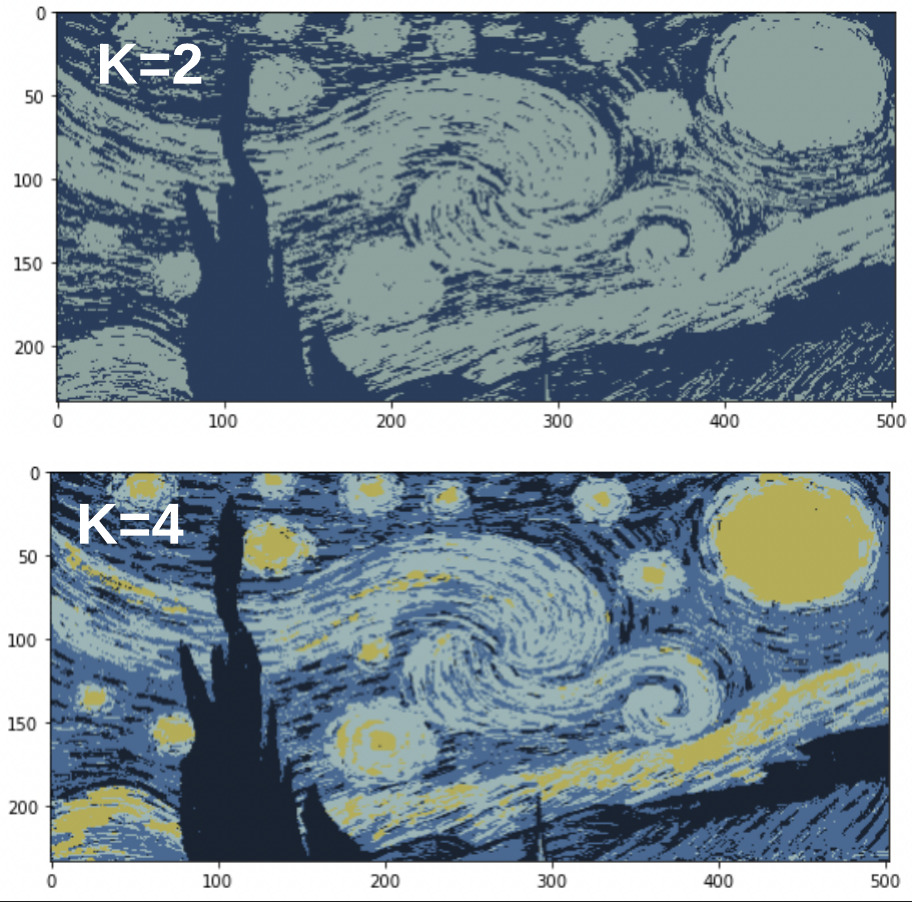
Multivariate Gaussian Mixture Model
Instead of a traditional 2D gaussian curves, here you'll be finding the probability that a pixel belongs to a certain Multivariate Gaussian distribution. Then adjusting the distributions in an iterative step, kind of like in k-means clustering
You can start going through the documents in the assignment (public repo for GT students: omscs6601/assignment_5)
I would start by reading:
read/gaussian.pdfto understand how multivariate Gaussians work- Watching Clustering (4): Gaussian Mixture Models and EMs on YouTube
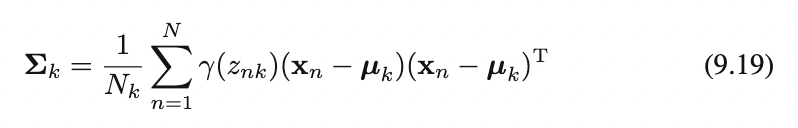
First thing you'll need to implement is finding the covariance matrix of a multivariate gaussian distribution
Basically implementing the following equation found in read/em.pdf of the ^ github repo
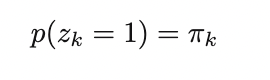
Next you will choose random points from your picture, and make the covariance matrix for each point, as well as component mixing coefficients.
You have to implement a lot more functions, while following the papers and reading a bunch of numpy documentation.
I myself took a lot of help from two posts in my semester's Ed stem forum, which really explained well what you want to be doing.
You'll probably just have to ask your teammates and fellow students for help on this one, the prob and Estep functions are gnarly.
In the end, you end up with this though 🙂
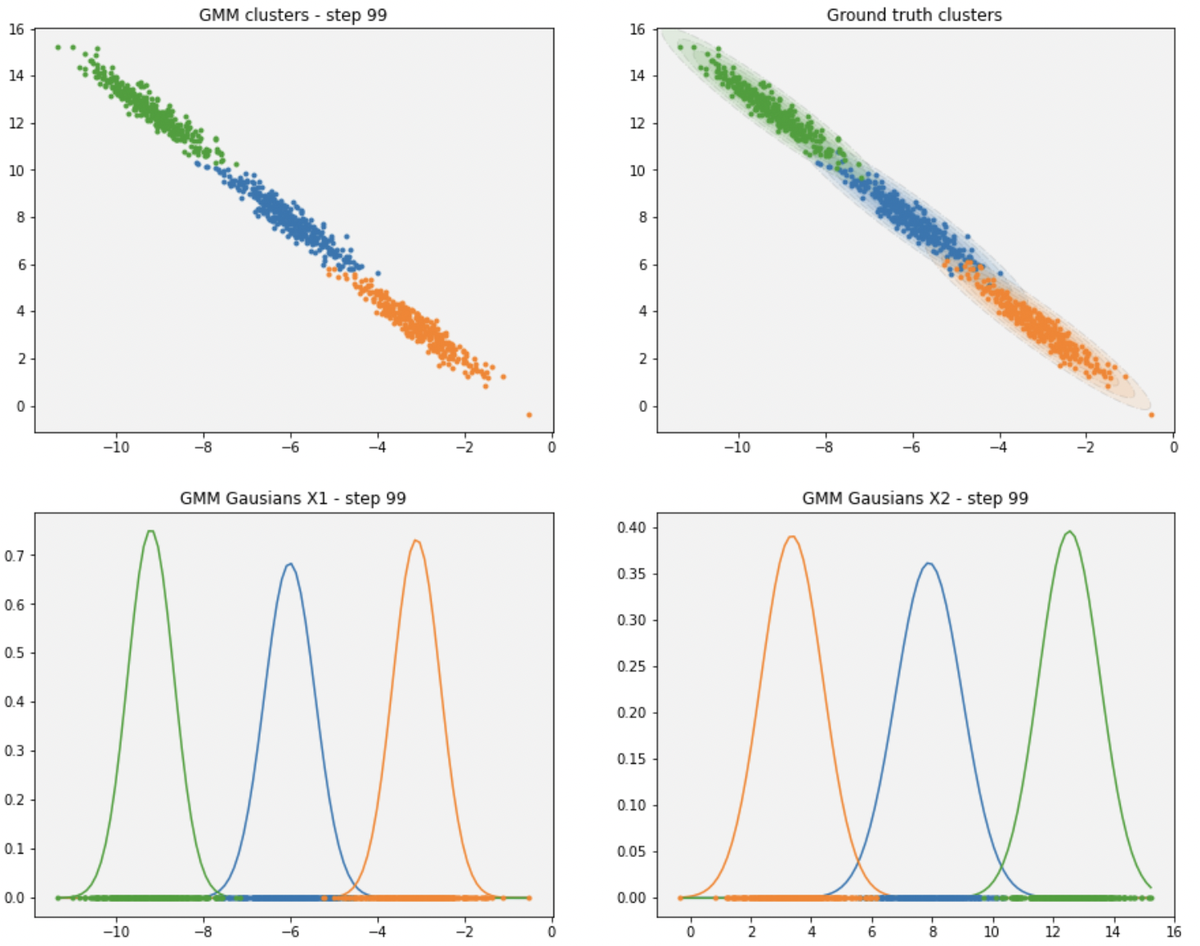
The last part of this project is just convergence criteria.
Bayes Information Criterion penalizes models that have a lot of parameters, and you implement it in your algoritm: Bayesian_information_criterion
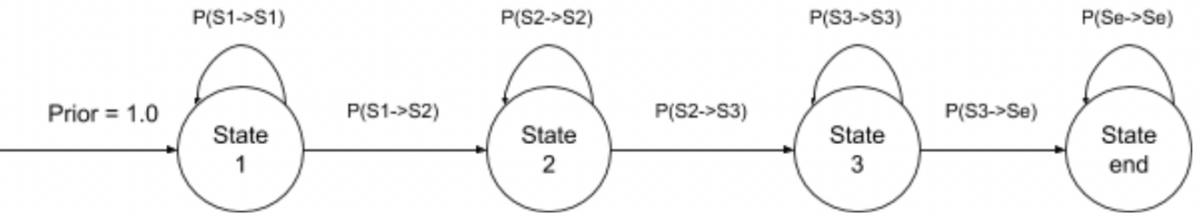
Hidden Markov Models
In this assignment, you will make state machines (models) that compute the probability of one hand movement type from one stage to the next, to predict a word that someone is signing in sign language.
You track the y coordinates of the hands of someone signing, and those coordinates are the input to your model.
You can also start reading through this repository (through GT credentials) at omscs6601/assignment_6
It's not that much code, just filling in probability tables according the the sheet you are given.
You only get 10 submissions on gradescope so choose wisely. I think it took me 4-5 tries.
Exams
The Midterm is worth 15% of your final grade
- I got 65% on it
The Final is worth 20% of your final grade
- I got 62%
Grade breakdown
Here's what I got in the class Spring 2022
- Assignment 1 - 92%
- Assignment 2 - 0%
- Assignment 3 - 81%
- Assignment 4 - 100%
- Assignment 5 - 92%
- Assignment 6 - 100%
- Midterm - 65%
- Final - 62%
Final grade: 83.07% of a B grade